

Three long-term economic trends all point towards zero: 1- official interest rates (5,000 years); 2- dividends from stock markets as a proportion of total returns (70 years); and 3- economic growth rates (2,000 years). What are the potential consequences for our economic model if these mega-trends are correct and if they persist – what next?
I wrote this text in 2018 as a thought experiment. It was never published at the time because I was not sure how such a heretical narrative might be beneficial… but now, as the COVID-19 pandemic triggers a global financial calamity, I hope people find it useful as they navigate the crisis and contemplate the systemic changes that may be necessary.
1. Preamble – seeking a “market rate of return”
The original intention of this article was to define what a “market rate of return” is for impact investors. Impact investors, who prioritise creating positive non-financial value alongside financial return, often argue that it is possible to achieve a “market rate of return” whilst at the same time having a positive impact on society or the environment. That may be true – and it may be a necessary defence – in which case, what is a “market rate of return” in the first place?
Typically, a “market rate of return” is the return an investor expects to make on an investment based upon its historical or probable rate of return under varying scenarios.[1]
To quantify this more explicitly, I started researching longitudinal studies of pricing data for capital markets. The purpose was to enumerate what the historic return benchmarks[2] are for the mainstream markets, and to infer what expectations may be appropriate for impact investing. Particularly, the goal was to signal what benchmarks are realistic to attract more mainstream commercial capital towards impact investing.
However, this investigation revealed newly published information that challenges the conventional notion of a “market rate of return” – and even some of the orthodoxy underpinning finance and the economy more broadly.
New evidence, bigger questions
This article then morphed into a summary of the newly published information, which raises heretical questions such as:
- What if long-term data show that interest rates have been declining for centuries, as well as millennia. Can they return to conventional textbook norms?
- What if stock markets have overheated with frothy capital appreciation, masking the fact that dividends have been dwindling for decades?
- What if economic growth in mature markets has peaked and may continue to slow down?
- Investors typically look towards emerging markets for growth in order to secure financial returns – either specific geographic regions, sectors, or categories like impact investing – but presumably in time these markets will also mature?
- What if this constellation of trends is correct, even vaguely – is it then possible for capital markets (let alone impact investing) to continue being as financially lucrative as they have been in the memorable past?
And:
- Are we therefore compelled – at least hypothetically – to stress-test this constellation of trends? … and even to contemplate the possibility of an entirely different economic paradigm in future?
2. Inconvenient data and fresh evidence
Supporters of the CAPE ratio would argue that stock markets may indeed be ready to burst. This ratio, which tracks data from the S&P 500, is currently (23 Aug 2018[3]) higher than at the time of the stock market crash of 1929 (Black Tuesday). It only previously exceeded this level in the run-up to the dot-com crash of 2000. It is now also higher than it was in 1987 when stock markets crashed on Black Monday, and in 2008 when the collapse of Lehman Brothers triggered the most recent global financial crisis.
Figure 1: Cyclically Adjusted Price Earnings Ratio (CAPE Ratio)
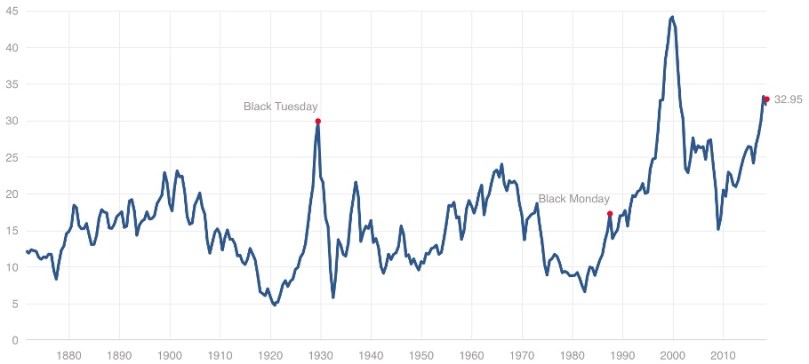
Source: Shiller, Irrational Exuberance, chart courtesy of mulpl (accessed 23 Aug 2018).
In seeking to understand what might sit behind the elevation in the CAPE ratio, I discovered the following longitudinal datasets (which are expanded upon in the sections below):
(A) Official interest rates (typically considered the baseline cost of capital) are at the lowest they’ve been since Babylonian times and are on a declining trajectory over the long-term (albeit with short-term spikes, the peaks of which generally track lower over time).
(B) Dividends from stock markets in developed economies have been declining since ~1945. Total returns have remained the same since the start, but over the last ~70 years an ever-increasing proportion of returns has come from capital appreciation and a dwindling proportion from dividends.
(C) The strong rate of economic growth that is currently considered normal appears to be reverting to its much lower long-term average closer to zero. The high levels of economic growth that most contemporary forecasts rely upon may have been an anomaly that peaked between 1920 and 1970 in established economies.
Let us examine each of these trends in more detail and consider what it might mean if they all materialise at the same time.
Exhibit A: Official interest rates are trending towards zero
In 2015 Andy Haldane, Chief Economist at the Bank of England, delivered a speech entitled ‘Stuck’. The central argument was that ‘official interest rates in the major economies remain stuck at unprecedentedly low levels’, effectively zero, and that this is expected to continue as the new normal. A “normal” interest rate is one that is neutral, in other words, prevents the economy from either overheating or slowing down.
Haldane had previously said at a Parliamentary Committee hearing ‘that global interest rates were at their lowest-ever levels’. He was challenged about this assertion afterwards: ‘How do you know they weren’t lower in Babylonian times?’. In response, he commissioned research into historic interest rates and produced the following chart that indeed tracks interest rates back to Babylonian times.
Figure 2: Historic interest rates
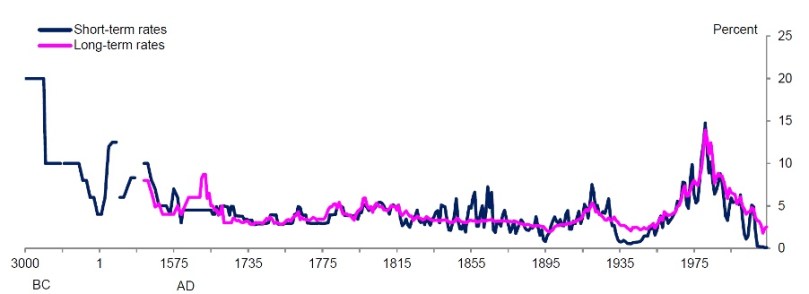
Source: Haldane, Stuck (Speech at the Open University, London), Bank of England (30 June 2015).
Except for a recent anomaly around the 1970s, which saw interest rates rise substantially, they have been falling consistently for 5000 years. The spike in the 1970s coincided with a relatively short period of history in which central banks intentionally allowed interest rates to go up in support of ‘the belief that unemployment could be permanently reduced at the expense of higher inflation’. This is no longer the case and nowadays most central banks are given a mandate to keep inflation low.
Exhibit B: Dividends produced by stock markets are declining
Combined historic stock market data for the most established markets was published by Stanford University in 2017. This academic research analyses the performance of stock markets over the 400 years since their origin in the early 17th century.
It makes the general conclusion, as revealed in the chart below, that nominal returns per year for the entire period are broadly consistent and averaged between 6% and 8%. In accordance with the previous data on debt interest rates, it notes that the average total return rose in latter half of the 20th century, but that this average rise to 12% coincided with the period of high inflation in the USA and other established economies.
Figure 3: Average annual real returns
Source: Golez and Koudijs, Four Centuries of Return Predictability, Stanford University Graduate School of Business (30 January 2017).
However, the report also notes a significant new trend that has embedded itself over the last ~70 years. Nowadays total returns are increasingly coming from asset price appreciation and decreasingly generated as dividends. This subtle change has remained hidden in most analysis because the asset price appreciation has replaced dividends nearly like-for-like.
The average proportion of returns generated by asset price appreciation over the whole period was 37%. Since ~1945 this proportion increased substantially to 57%. The following chart shows visually how average dividends, expressed as the dividend-to-price ratio, are on a declining trajectory.
Figure 3: Dividend-to-price ratio

Source: Golez and Koudijs, Four Centuries of Return Predictability, Stanford University Graduate School of Business (30 January 2017).
Stock markets are ultimately functions of the underlying economies they serve. It is therefore important to study the corresponding economic performance data for the same period.
Exhibit C: Economic growth has peaked and is now slowing
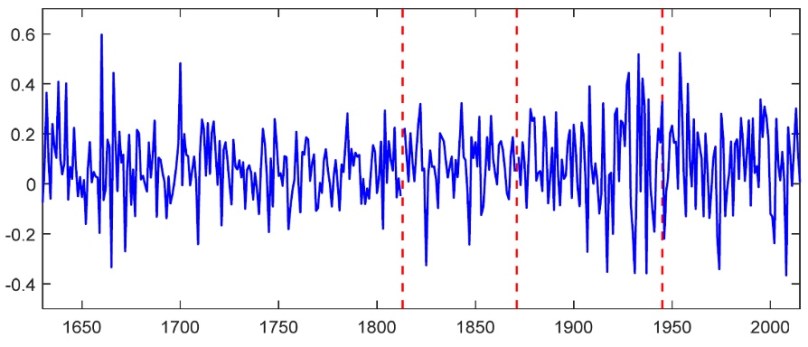
Economic growth across the world, measured traditionally as the growth of Gross National Product (GDP) per person, has averaged 1.4% per year over the two millennia between the year AD 1 and 2010. These independent data reveal that global growth has strong variability but effectively increased more than 10-fold after the industrial revolution, averaging 0.14% before 1800 and 1.5% thereafter.
This rate of increase is assumed to continue. The International Monetary Fund (IMF) supported a forecast made in 2017 that global GDP growth will be confirmed at 3.1% for 2016, thereafter rise to 3.4% for 2017 and 3.6% for 2018. For any given year or series of years, these future growth rates appear to be within the standard range, which can swing between plus ~15% and minus ~15%. They are also broadly in line with an extrapolation of the current trend.
Figure 4: GDP/person growth for all countries globally (forecast based upon current trend)

Source: Self, using data from The Maddison Project: collaborative research on historical national accounts. The Economic History Review (2013 version).
However, there is at least one dissenting claim that ‘economic growth is almost over’ in the USA – that it peaked between 1920 and 1970, and is now declining back to pre-industrial era rates closer to zero. Not surprisingly this opinion is strongly disputed.
Nevertheless, independent data – the same source used for producing the global chart in Figure 4 previously – not only validate the dissenting claim for the USA, but show that this trend is also true for Western Europe. Circumstantially, these economic trends seem to correlate with the decline of the dividends-to-price ratio since ~1945 presented in Figure 3 above.
Figure 5: GDP/person growth for the USA and Western Europe

Source: Self, using data from The Maddison Project: collaborative research on historical national accounts. The Economic History Review (2013 version).
Current global growth rates appear to be propped up by the emerging economies, but in time these economies will also mature. The resulting question is twofold: whether the emerging economies will mature any differently to the established economies; and whether established economies will find a new economic dynamo consisted with the historic trends that still underpin most forecasts?
Some, like the World Economic Forum, argue that the growth in new data technologies, intangible assets, a digital economy, and innovations like Artificial Intelligence will fill the gap. They argue that the 4th industrial revolution is the next growth engine and already generating substantive net productivity increases. If they are correct, then it is at least one plausible reason to subscribe to the economic projections of the IMF. But if not… then what?
3. What if …
What if the expectation for normative “market rates of return” within a perpetual growth paradigm is not as justified as the conventional wisdom suggests?
On the face of it, this might seem like a preposterous question. Particularly because (at the time of writing in 2018) interest rates are rising back towards their recent historical averages, Wall Street is recording its longest bull run ever, and there is a booming economy in the USA.
But, contrary to these shorter-term data and norms of the last ~70 years, the mega-trends in the longitudinal data suggest that it is indeed reasonable to ask what would happen if:
- Official interest rates continue to trend lower than recent averages, potentially closer to zero.
- Dividends as a proportion of stock market returns continue to fall.
- Global aggregate GDP growth stagnates, or de-growth occurs.
In addition, and even if only to hypothetically stress-test the scenario, what if:
- These three conditions embed themselves as new norms – partially, proximately or cumulatively as a perfect storm?
- The intangible economy of the 4th industrial revolution does not deliver an elixir of growth?
- Historic performance of profitability and growth over the industrialised era, and specifically the mid-20th century in established economies, was an historic anomaly and not a long-term sustainable trend?
In other words, what if the conventional wisdom of a perpetual growth paradigm is replaced by a paradigm of stasis (or even entropy)?
Even if such a new global paradigm were to manifest, there would still be opportunities for growth and profit in isolated pockets. For example, in emerging economies, segments within established markets, or trading gains and arbitrage at the margins. Not all capital will be priced at zero because risk-adjusted pricing on a deal-by-deal basis would remain – a bona fide cost of capital, or risk premium, is necessary to compensate for capital losses elsewhere across a portfolio.
The point is however more nuanced and systemic, that for ostensibly efficient markets within a global paradigm of stasis or entropy, the potential for aggregate “market rates of return” may dwindle substantially, potentially well below current expectations and possibly even closer to the risk free rate of capital (which may entrench itself around zero).
In such an aggregate scenario, net profits for some will be offset by net losses for others. To put it another way, if an overall paradigm of non-growth were to emerge as a new normal, and if there are still expectations by some people for a “market rate of return” well above zero, then other people elsewhere in the system will need to subsidise that gain by accepting concessionary returns or losses.[4]
In reality, a paradigm of stasis or entropy may or may not transpire. But at minimum it would be prudent to stress-test scenarios that consider an extended period of insipid growth, no growth, or de-growth. It seems sensible to at least understand the potential consequences if the long-term mega-trends persist, even if these scenarios are different to most establishment forecasts.
4. Conclusion – what next?
I do not know.
But it would be folly to persist with current expectations of “market rates of return” if it became evident that they depend upon an unrealistic growth paradigm. Unrealistic expectations are dangerous if they inadvertently coerce behaviours that are misguided (and potentially nefarious) in the false hope that the expectations are achievable.
My interpretations could be wrong, so I invite people to point this out. Nevertheless, the underlying data are from reputable sources and the mega-trends towards zero appear to hold up under preliminary scrutiny.
The question remains – what next?
– o –
Footnotes:
1. [Back to location in text] Investopedia’s definition of market rate of return, see here.
2. [Back to location in text] The risk-free rate of capital and the risk premium of stock markets
One of the most common reference baselines is the rate at which governments can borrow money from the capital markets. The interest rates being charged to the governments of established economies, such as the USA, Germany, Japan or the UK, is often referred to as the risk-free rate of capital because lenders do not expect these countries to default and therefore they represent the safest possible place to store their capital. For the four countries above, the OECD reported in 2017 that (then) current interest rates for long-term debt (maturing in 10 years) was 2.3%, 0.22%, 0.01%, 1.08% respectively – the spread between these rates is out of scope for this high-level article.
Intuitively, investments in companies listed on the stock markets are considered higher risk than loans to the governments of established economies, and there is general acknowledgement for an equity risk premium to compensate. This premium has varied between 3.5% and 5.5% over the last century (sometimes as high as 7% according to other sources). In other words, it is generally expected in developed economies that investments in the stock markets will over time generate 3.5% to 7% more than can be earned from lending capital to the government.
The statement above is corroborated by data and conventional wisdom. For example, this article quotes Warren Buffet saying that stocks will probably rise 6-7% per year on average. Put differently, this is the average return that investors could expect if they spread their investments across the whole stock market for a long enough time to ride out volatility as well as boom and bust cycles. The argument is supported by data that the S&P 500 averaged a return of 7% from 1950 to 2009, after inflation and including both capital growth and dividends in the total return.
However, there are notable critiques of the equity risk premium. Since the 1980s they have been arguing that the intuitive notion that stocks are much riskier than bonds is not a sufficient explanation for the difference. If they are correct, then it is unclear what justifies the equity risk premium that stock market investors earned in the past, and continue to earn in the present.
In private capital markets – debt and equity investments that are not listed on publicly traded exchanges – it is reasonable to expect a higher risk premium in individual deals because these investments are less rigorously regulated, more illiquid, and are used to raise and invest smaller amounts of capital. Raising capital via private loan or equity placement typically involves preparing simpler packages of information than an investment prospectus for a public listing. Regulators try to ensure that investors in private markets are experienced and professional, and therefore able to appreciate these risks themselves, and that they price capital accordingly. Of course there will be some people who rely on information asymmetries and profit from it. Nevertheless, within competitive and well functioning markets, any windfall profits or surpluses generated on the one hand should in aggregate be offset by similar amounts in losses from bad investments on the other.
This balancing effect of efficacious markets appears to be backup up by performance data. This is true even for hedge funds, which in aggregate do not appear to match their reputation for generating superior returns. The unweighted average 3-year performance of hedge fund indices (at the time of research in 2017) was 1.88%. There are individual exceptions, but on aggregate this performance is a lot lower than most people think. Surprisingly, average returns are more closely aligned with the risk-free rate of capital (lending capital to sovereign governments) than the performance of stock markets.
On face value, and if large and liquid public securities markets are ostensibly efficient, it is unclear why the equity risk premium persists at the level it does, and why the returns from stock markets are on average higher than some non-listed markets, for example like hedge funds.
To clarify – this is not to argue that the equity risk premium should be zero, nor to try debunk the Efficient Market Hypothesis. Rather, but merely to question whether the equity risk premium at its current level is sustainable.
3. [Back to location in text] As an aside note – this date is also significant because it is the day Wall Street set a new record for the longest bull run in history, 9½ years, measured as the S&P 500 stock market index rising without a fall of 20% or more. The previous record bull run ended when the dotcom bubble burst in 2000.
4. [Back to location in text] Anecdotally, there are numerous examples that try to balance market rate of returns and concessionary returns. It is often argued that this approach can align private markets with policy priorities and non-financial objectives. The OECD refers to this dualistic approach as blended capital, and has a dedicated work stream to promote it.

Hallo Karl-Heinz,
Ein sehr interessanter Artikel.
Du hast ja beinahe Deinen Beruf verfehlt. Du solltest ja Prophet werden. 😉
Wir müssen nun sehen wie es sich mit der Weltwirtschaft weiter entwickelt.
Sicher gar nicht so einfach, auch in Verbindung mit dem Artikel von
Yuval Noah Harari gesehen. Es könnte eine Wirtschaftliche /
Soziologische Krise entstehen.
Denn arme Arbeitslose, Big-Brother like überwachte, könnten aus einem
Alfred Hitchcock Film stammen.
Ohren steif halten
Vati
Danke 🙂
I don’t find many impact investors truly taking stock of what advantages a truly better economic system would bring to them..especially in the diversity of return opportunities. Karl, what do you think of Mariana Mazzucato’s work in reconsidering capitalism with eyes on what purpose we want to create value for…?
Thanks Timothy! I’m a big fan of Mariana Mazzucato’s work, which I find optimistic and pragmatic.