
A landmark study released today via the Government’s open data portal reveals for the first time historic performance of UK social investment activity.
The total financial performance (comparing all capital draw downs with all capital, interest and fee payments) over the 12 year period was negative 9.25% (-0.77% annualised)*. Counterintuitively, this is remarkably good given that pricing of capital was driven by affordability and not risk adjusted. Moreover, most of these social investments were made after the investees had been refused finance from High Street institutions. They would therefore be classified as high risk deals.
The data
“I am glad to see that a careful, and data-oriented, study of social impact investing is being made. So much research effort is spent on studying investments, it is nice to see this focus on social impact investments.”
Economics Professor Yale University and 2013 Nobel Laureate
The anonymised data sample covers 425* closed investments relating to £42m of capital deployed. The dataset includes both debt and equity deals made from 2002 until 2014 by CAF Venturesome, Key Fund and Social Investment Business. It was published by EngagedX and the Social Investment Research Council with the support of the RBS Group.
This is the largest aggregate set of performance data that has been assembled on social investing since it became recognised as a distinctive market in 2000 – when the UK Government established the Social Investment Task Force to improve Government’s capacity for creating wealth, economic growth, employment and an improved social fabric in its poorest communities.
An improving market
The tabulation below compares the overall financial performance with the respective performance for the most recent 5 year period (2009-2013)* and the preceding period (2002-2008). It reveals how financial performance in the social investment market seems to have improved significantly since inception.
| Period | Overall 2002 – 2013* |
First 7 years 2002 – 2008 |
Last 5 years 2009 – 2013* |
| No. of deals | 425 | 149 | 276 |
| Capital deployed | £ 42,031,874 | £ 17,480,940 | £ 24,550,934 |
| Total return (over period) |
– 9.25% | – 17.50% | – 3.37% |
| Total return (annualised) |
– 0.77% | – 2.50% | – 0.67% |
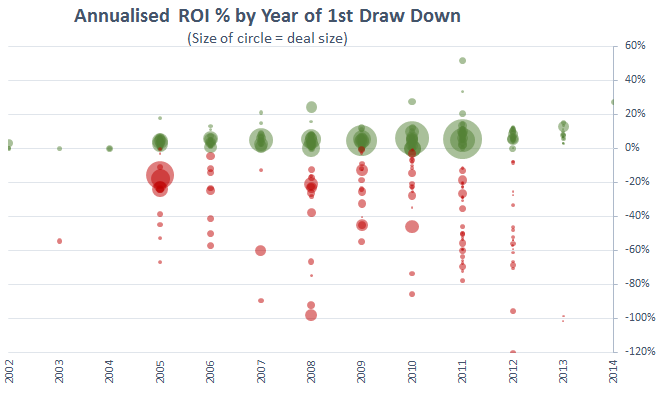
Analysing the deals by date of draw down, in other words assessing if total performance changed over time, the data suggests that financial performance is indeed improving. This is consistent with a market that is maturing. Deals made within the last five years delivered a total return of negative 3.37% (-0.67% annualised)* – three times better than the overall 12 year period and six time better than the seven year period preceding 2009, which was negative 17.50% (-2.50% annualised)*. This significant improvement is not only remarkable because it occurred in the wake of the financial crisis, but also statistically significant because it relates to over half the sample by both number of deals and amount of capital deployed.
An emerging market
The early days of any market are experimental and often prioritise market building strategies over financial gain. In this market, the initial focus was to test the viability of deploying repayable capital to social purpose organisations (like charities and social enterprises) who are unable to access mainstream finance. This social investment is an additional form of funding to augment the scarce sources of charitable grants and public subsidies, as well as revenue streams that are ad hoc or cyclical.
Put another way, in just over a decade of ambitious expectations and demanding conditions, the emerging social investment market is already achieving nearly full capital preservation with an improving trend. This historic performance indicates that deploying repayable finance to social purpose organisations is indeed a viable proposition – and arguably that the social investment experiment to date has been a resounding success.
Contextualising the data
However, this study is only the first step – to enable even better analysis, the dataset should be expanded to represent the full spectrum of investor motivations in the market. Transaction costs and management overhead also needs to be better assessed because an engaged investor approach is an integral ingredient for success. Investors frequently struggle with appraising the risk profile of new social investment deals, higher quality benchmark data would help them and this requires capturing more metadata of historic deals to better segment past performance. For example, to assess past deals by product type, sector, legal form of investee, geography, turnover, number of staff, and stage of development, amongst other criteria.
Next steps for real impact
Financial performance is only half the story of social investing. Being able to evaluate social impact as a bona fide non-financial return on investment is equally important. Without robust and comparable impact data, it is impossible to judge investment performance fairly and to understand the complex interrelationship between financial returns and presupposed social impact creation.
The experience of EngagedX on this project signposts to a potential pitfall for the impact assessment industry – it would be strongly advisable to avoid the complications and resultant high cost of retrospectively structuring data. With any luck, there will now be renewed determination to produce machine readable impact data that can be cost effectively used for comparative analysis.
The successful conclusion of this project and its valuable findings will hopefully encourage other social investors to be transparent with their data. It would be very exciting to see more voluntary reporting and for transparency to emerge as the hallmark that distinguishes social investing from mainstream markets. In line with recent critique of the social investment market – this sort of transparency could even emerge as an essential precondition for being a social investor.

If the more recent social investments have a -3.4% return in purely financial terms to the investor, and without any attempt to assess value generated for other stakeholders, such as savings in welfare, health or criminal justice budgets), or all the other SROI-type calculations, then it would indeed seem a viable approach.
How could we make these unmeasured benefits more visible, so that they would motivate more social investors? To publicise the individual cases would be one way.
Toby, indeed – I hope if anything this dataset now focuses the industry towards assessing impact performance on a comparable basis with financial returns so that we can assess the full spectrum of returns for deals. That way we can determine which investments are actually generating value for society (and may warrant a financial haircut… Or be topped up by cash subsidy or tax relief)) or which are just bad deals hiding behind the cuddly mask of being called a ‘social investment’. Proper impact assessment and impact performance will shine light where it’s needed
[…] repaid and can be deployed again. It’s also notable that, as Engaged X’s Karl Richter points out in his blog, the sampled market was improving over time. So while the return on investments made from 2002-2008 […]